Here’s How Much You Have To Earn To Buy A Home in These 27 Metro Markets
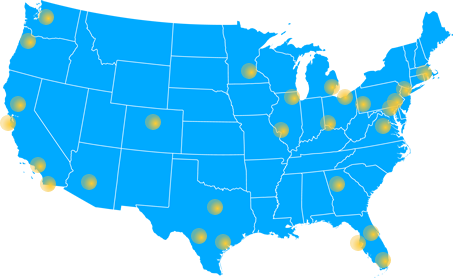
The median price of a house in 27 major metro areas in the U.S. is $222,700. In order to afford such a house with a 20 percent down payment in the fourth quarter of 2015, a family would need to earn at least $51,114, according to a new analysis by mortgage research firm HSH.com. That’s just slightly below the median annual wage of $53,000.
Of course, the old adage that all real estate is local holds true. A median-priced home in Pittsburgh costs $128,000, about a sixth of what it cost to buy a median-priced home in San Francisco. Residents of the former city would need wages of just $31,134 to become homeowners, while those in the latter would need to earn nearly $150,000.
The report used local home prices as well as local mortgage rates to compare the base cost of owning a house—mortgage principal, interest, taxes and insurance —but did not include other expenses such as maintenance and utilities. Here’s How Much Salary You Need To Earn:
| Cities | 30-Year Fixed Mortgage Rate | % Change from 3Q15 | Median Home Price | % Change from 4Q14 | Monthly Payment (PITI) | Salary Needed |
| National | 4.02% | -0.06% | $222,700 | +6.86 | $1,192.67 | $51,114.62 |
| Pittsburgh | 3.90% | -0.06% | $128,000 | +4.32 | $726.47 | $31,134.50 |
| Cleveland | 4.00% | -0.08% | $121,800 | +0.50 | $758.88 | $32,523.47 |
| Cincinnati | 4.02% | -0.09% | $136,600 | -1.09 | $792.56 | $33,967.01 |
| St Louis | 4.00% | -0.05% | $143,700 | +3.83 | $811.48 | $34,777.53 |
| Detroit | 4.07% | -0.05% | $148,667 | +5.69 | $861.34 | $36,914.56 |
| Atlanta | 4.03% | -0.07% | $169,200 | +7.29 | $876.19 | $37,551.08 |
| Tampa | 4.16% | -0.03% | $175,100 | +9.44 | $978.19 | $41,922.58 |
| Phoenix | 4.03% | -0.06% | $221,000 | +10.33 | $1,025.21 | $43,937.76 |
| San Antonio | 4.01% | -0.08% | $192,100 | +3.56 | $1,096.08 | $46,974.78 |
| Orlando | 4.08% | -0.03% | $205,000 | +13.89 | $1,115.59 | $47,810.81 |
| Minneapolis | 4.00% | -0.07% | $223,700 | +6.52 | $1,172.52 | $50,250.68 |
| Philadelphia | 4.00% | -0.06% | $213,700 | +0.19 | $1,204.52 | $51,622.40 |
| Dallas | 4.05% | -0.04% | $206,200 | +8.76 | $1,208.81 | $51,806.01 |
| Houston | 4.04% | -0.05% | $209,200 | +4.97 | $1,217.16 | $52,163.93 |
| Baltimore | 3.98% | -0.03% | $233,500 | +0.13 | $1,233.51 | $52,864.57 |
| Chicago | 4.04% | -0.04% | $209,800 | +7.53 | $1,352.93 | $57,982.85 |
| Sacramento | 4.05% | -0.08% | $294,100 | +9.45 | $1,450.01 | $62,143.45 |
| Miami | 4.07% | -0.07% | $286,000 | +7.92 | $1,471.12 | $63,048.07 |
| Portland | 4.05% | -0.08% | $318,800 | +10.35 | $1,538.07 | $65,917.47 |
| Denver | 4.05% | -0.08% | $353,500 | +12.29 | $1,596.85 | $68,436.22 |
| Seattle | 4.09% | -0.09% | $385,300 | +9.46 | $1,829.91 | $78,424.93 |
| Washington | 4.01% | -0.06% | $371,600 | -0.32 | $1,834.60 | $78,625.71 |
| Boston | 3.96% | -0.07% | $393,600 | +2.71 | $1,940.20 | $83,151.43 |
| New York City | 4.00% | -0.06% | $384,600 | -0.39 | $2,024.64 | $86,770.19 |
| Los Angeles | 4.02% | -0.04% | $481,900 | +6.88 | $2,217.60 | $95,040.20 |
| San Diego | 3.90% | -0.21% | $546,800 | +10.89 | $2,407.18 | $103,164.96 |
| San Francisco | 3.94% | -0.04% | $781,600 | +9.21 | $3,453.24 | $147,996.19 |

No Comments